Feature Adoption
Feature adoption tells you which customers actually use the parts of your product that matter. You describe each feature with an adoption rule built from a usage metric you already track, optionally set how quickly customers should adopt it, and Customerscore keeps track of who has adopted what, who is on time, and who is falling behind.
Adoption shows up in three places:
- Settings → Feature adoption: the list of adoption rules.
- Statistics → Feature adoption: adoption across your whole customer base.
- The Adoption tab on every customer: that customer's progress and timeline.
How It Works
An adoption rule watches one customer metric and a value:
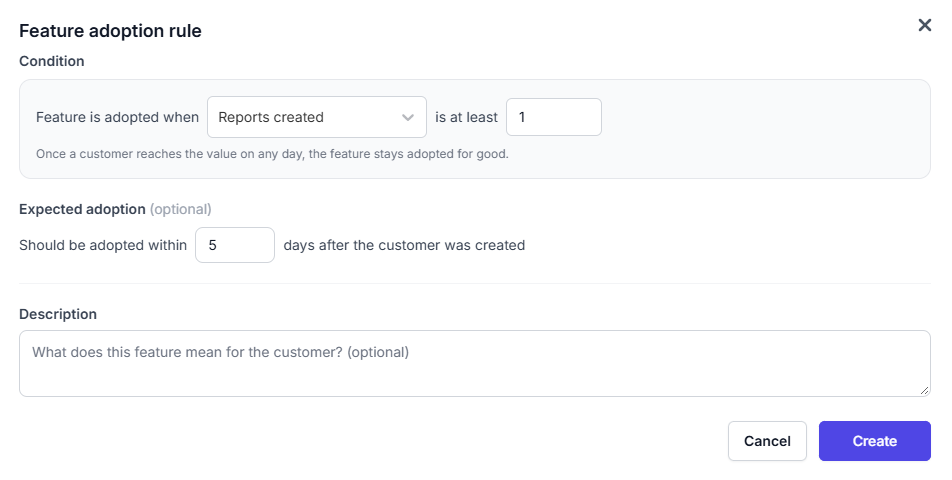
Feature is adopted when Reports created is at least 1
The first time a customer's metric reaches the value on any day, the feature counts as adopted, and it stays adopted for good. If usage drops later, the adoption date doesn't change. This is deliberate: adoption answers "has this customer ever got value from the feature?", while ongoing usage is what your Health Score measures.
Every rule is shown under the name of its metric, so name your metrics clearly (for example Reports created rather than reports_cnt).
Creating an Adoption Rule
Rules can be created and edited by admins; every user can see them.
- Go to Settings → Feature adoption.
- Click Add adoption rule.
- Pick the metric and enter the value it has to reach.
- Optionally set Expected adoption, the number of days after the customer was created within which the feature should be adopted.
- Optionally click Add description to explain what the feature means for the customer.
- Click Create.
Any numeric or calculated customer metric can be used, and each metric can have one rule.
Choosing Good Rules
- Pick a metric that proves value, not just a visit. "Reports created ≥ 1" or "Integrations connected ≥ 1" says more than "Logins ≥ 1".
- Use the value to express depth. "Team members invited ≥ 3" separates a real team rollout from a single curious user.
- Use cumulative metrics where you can. Because adoption is permanent, a running total (all-time API requests) and a daily count both work, but a cumulative metric makes the rule easier to reason about.
- Start with the 3–6 features that predict retention. Every rule has the same weight in Feature adoption %, so a long list of minor features dilutes the signal.
The Rules Overview
Settings → Feature adoption lists all rules with their condition, how many customers have adopted each one, and the expected time.
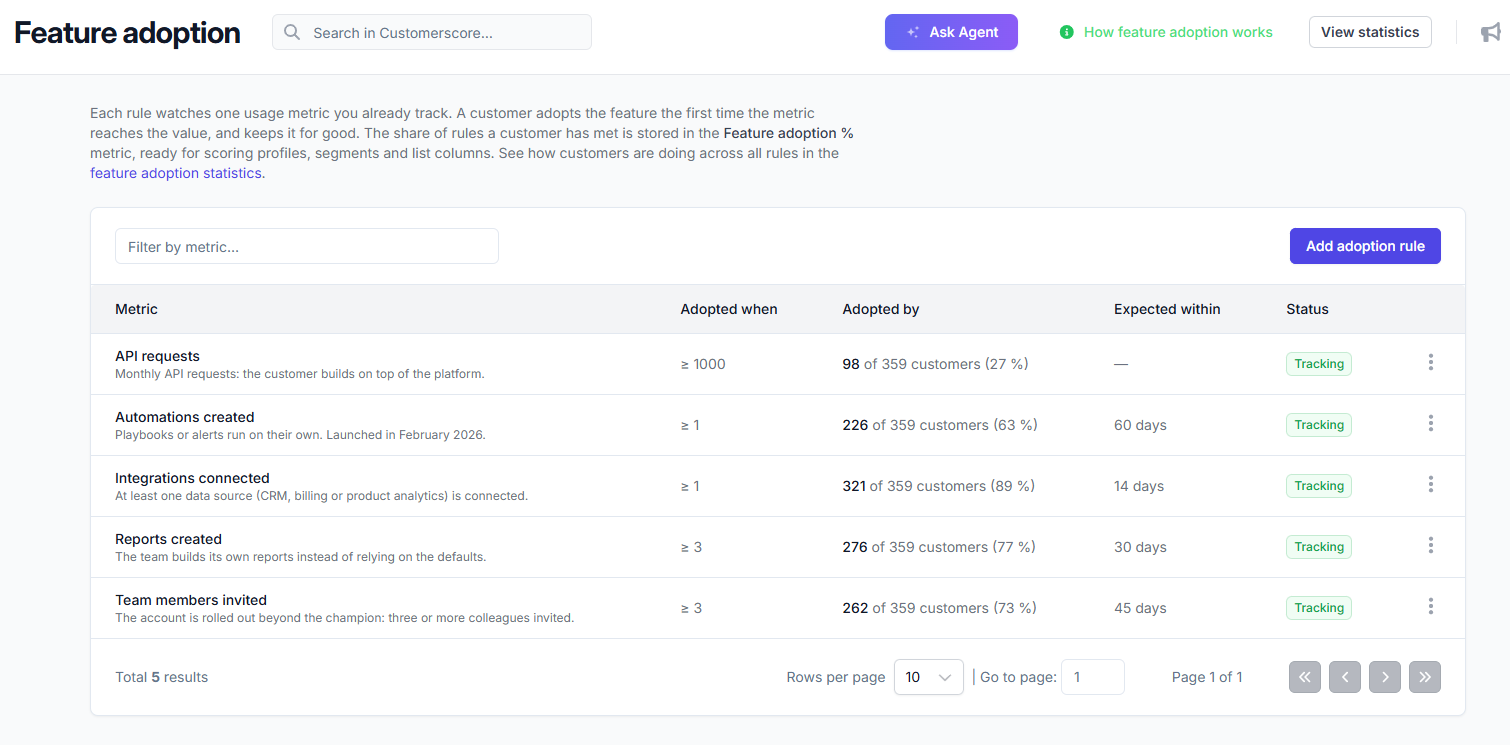
The Status column shows Tracking for rules that are live and Calculating while the history is being filled in (see below). From the ⋮ menu you can Edit, Recalculate history, or Delete a rule. Deleting a rule also deletes its adoption history.
Adoption History Is Filled In for You
When you create a rule or change its metric or value, Customerscore replays up to 365 days of that metric's history and finds the day each customer first reached the value. While this runs, the rule shows Calculating; statistics for that rule appear as soon as it's done. After that, adoption is evaluated with every data processing run, so new adoptions show up as soon as your data updates.
Use Recalculate history if you have back-filled or corrected historical data for the metric.
If a customer already met the rule on the very first day of the available history, their real adoption may have happened earlier. The date shown is the earliest one the data can prove.
Expected Adoption and Statuses
Setting Expected adoption turns each rule into a goal with a deadline, counted from the day the customer was created in Customerscore. Each customer then gets one of these statuses per rule:
| Status | Meaning |
|---|---|
| Adopted on time | Adopted within the expected window |
| Adopted late | Adopted, but after the expected window |
| Due in N days | Not adopted yet, the window is still open |
| Overdue N days | Not adopted and the window has passed |
| Adopted | Adopted (the rule has no expected window) |
| Not adopted | Not adopted yet (the rule has no expected window) |
The window starts on the customer's creation date in Customerscore. For customers imported when you first connected your data, that is the import date, not the date they actually signed up. Long-standing customers may look like they adopted everything on day 0. Expected windows are most useful for customers who joined after you started using Customerscore.
Feature Adoption Statistics
Statistics → Feature adoption (also reachable via View statistics in the settings) shows adoption across all active customers. Use the segment dropdown to look at a single segment, for example only this quarter's new customers or one pricing plan.
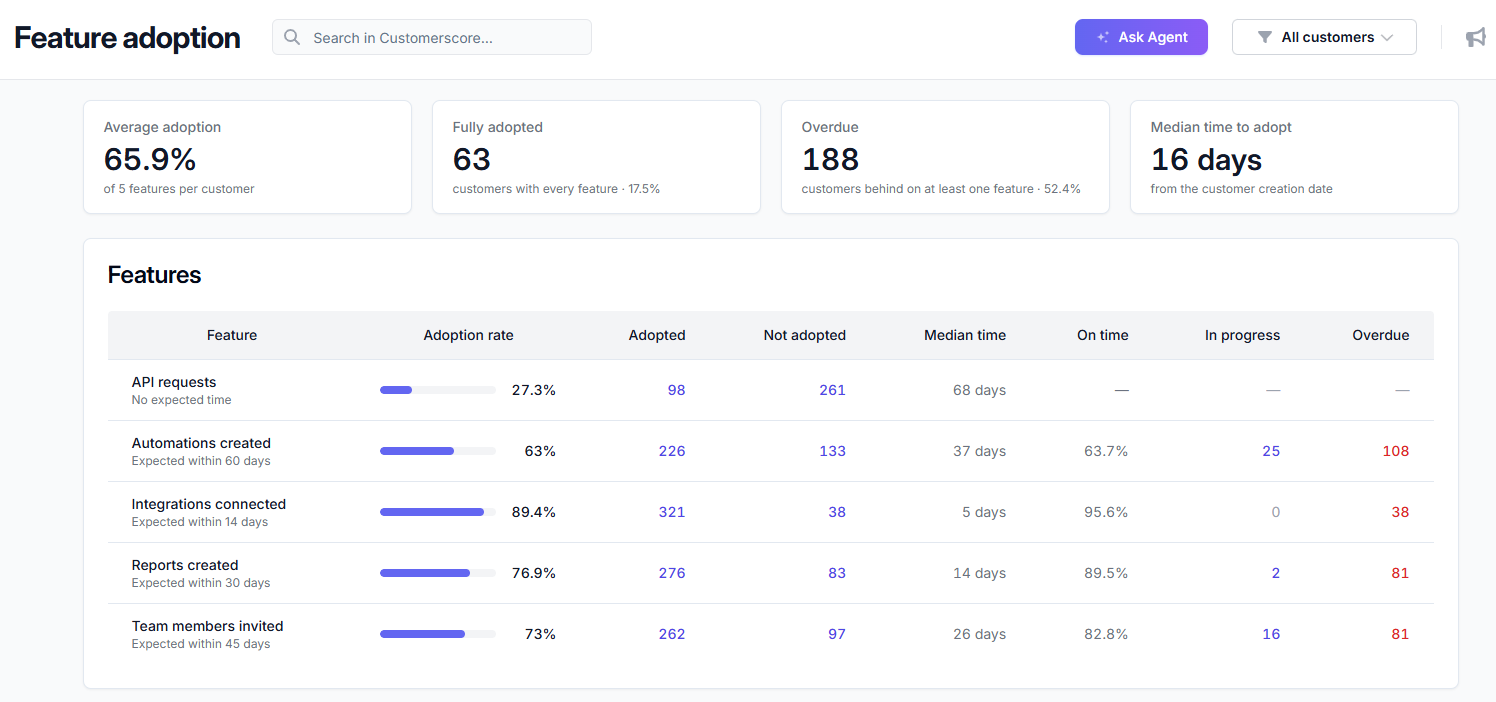
At the top, four tiles summarize the whole base:
- Average adoption: the average share of features adopted per customer.
- Fully adopted: customers who have adopted every feature.
- Overdue: customers behind on at least one feature.
- Median time to adopt: median number of days from the customer's creation date to adoption.
The Features table has one row per rule: the adoption rate, adopted and not-adopted counts, median time to adopt, the share adopted on time, and the number of customers still in progress or overdue. Click any count to open the list of customers behind it. It's the fastest way to build an outreach list for a feature.
Charts
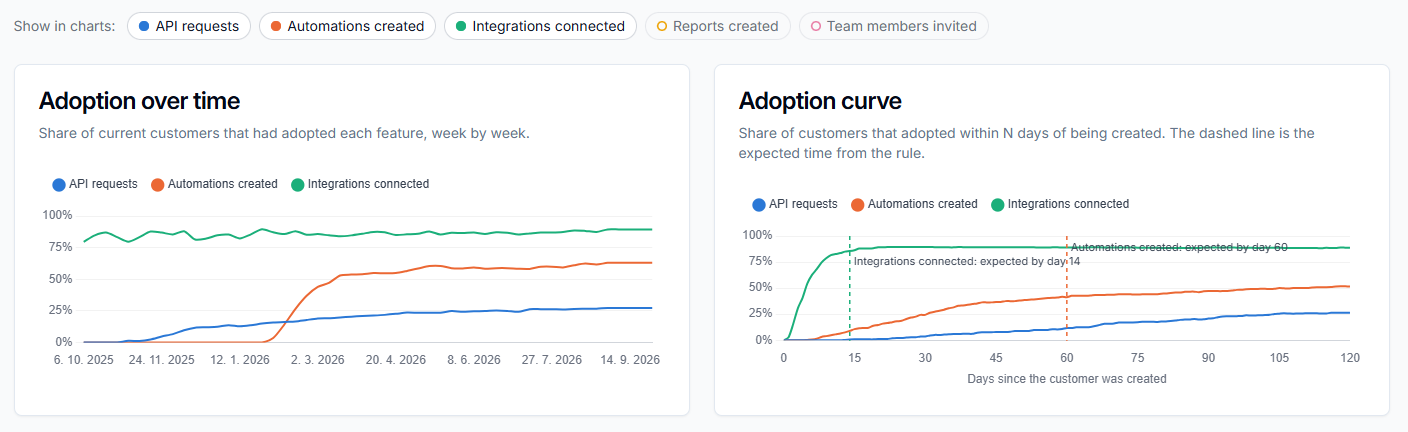
Below the table, pick up to eight features with the Show in charts chips:
- Adoption over time: the share of current customers that had adopted each feature, week by week. A rising line means adoption is spreading through your base.
- Adoption curve: the share of customers that adopted within N days of being created, with the expected window drawn as a dashed line. A steep early curve means the feature is easy to discover; a long flat tail points to an onboarding gap.
Adoption on the Customer Detail
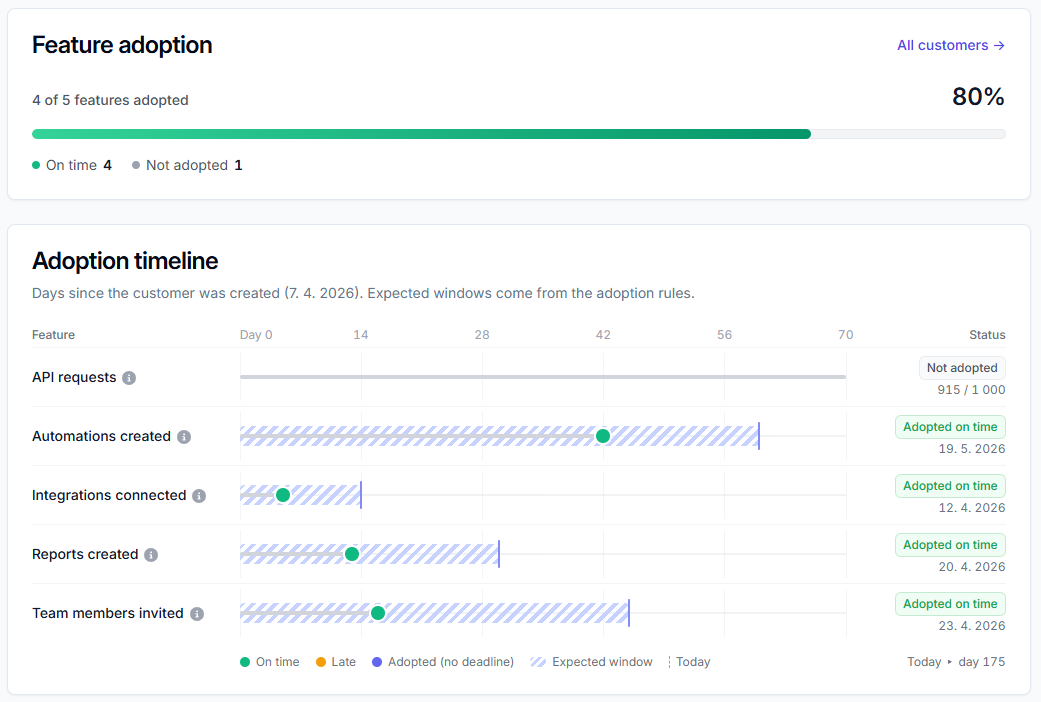
The Adoption tab on each customer shows how many features they have adopted, a breakdown by status, and an adoption timeline with each feature as a row, with the adoption date plotted against the expected window. It's a quick check before an onboarding call, a renewal, or a QBR.
Using Adoption in Scoring and Segments
Customerscore adds two metrics to every customer once you create your first rule:
| Metric | Meaning |
|---|---|
| Feature adoption % | Share of adoption rules the customer has met (0–100) |
| Features adopted | Number of adoption rules the customer has met |
They behave like any other metric:
- Scoring profiles: add Feature adoption % to your Health Score so customers who never get past the basics score lower. The metric is calculated before scores in each data processing run, so the score always uses the current value.
- Segments and filters: for example Feature adoption % below 50 to find customers who need an onboarding push, then turn it into a worklist.
- Customer list columns: show adoption next to health and MRR.
The values come from your adoption rules, so these two metrics can't be used to define an adoption rule themselves. Adding, removing, or changing a rule updates them for all customers.
FAQ
Why does adoption never go back down?
Adoption records the moment a customer first got value from a feature. Whether they keep using it is a question for your Health Score and Smart Alerts on the underlying metric.
Can one rule combine several metrics?
Not directly. One rule watches one metric. If you need a combination, create a calculated metric in Settings → Metrics and use it in the rule.
Which customers are counted?
Active customers. Churned customers are left out of the adoption counts and statistics, matching the Customers page.
Why does a new rule show "Calculating"?
Customerscore is replaying the metric's history to find each customer's adoption date. The rule starts Tracking as soon as the replay finishes.